((-1.0, 6.0), (0.0, 2.0), (1.0, 0.0), (2.0, 0.0), (3.0, 2.0), (4.0, 6.0))Functions and Graphs
Understand functions as mappings and connect formulas, tables, graphs, and rates of change.
Learning objectives
After this lesson you should be able to:
- explain a function as a rule that assigns each input exactly one output;
- translate among formulas, tables, graphs, and verbal descriptions;
- identify domain, range, intercepts, and zeros;
- compute and interpret average rate of change;
- use a graph to understand how changing inputs changes outputs;
- recognize common families of functions by shape.
Motivation
Functions are the central objects of quantitative mathematics. Calculus studies how functions change. Statistics uses functions to model relationships. Optimization searches for inputs that make a function large or small. Machine learning fits functions to data.
Algebra prepares you for all of this by teaching you how to move fluently among four representations:
- a formula,
- a table,
- a graph,
- a verbal description.
What is a function?
A function assigns each input exactly one output.
f(x) = 2x + 1If the input is x = 3, then:
f(3) = 2(3) + 1 = 7The input is 3. The output is 7. The ordered pair is (3, 7).
Key idea
A function can have many inputs, but each allowed input has exactly one output.
Domain and range
The domain is the set of allowed inputs. The range is the set of outputs the function actually produces.
For:
f(x) = x^2over all real numbers:
- domain: all real numbers;
- range: all real numbers greater than or equal to
0.
For:
g(x) = sqrt(x - 2)over the real numbers:
- domain:
x >= 2; - range:
g(x) >= 0.
Domain restrictions often come from denominators, even roots, and logarithms.
Formula to table
A table makes individual input-output pairs explicit.
This table is not the function itself. It is a sample of the function. The formula tells us the output for every allowed input; the table shows selected inputs.
Formula to graph
The graph of a function is the set of points:
(x, f(x))The package includes reusable plotting helpers for this input-output view.
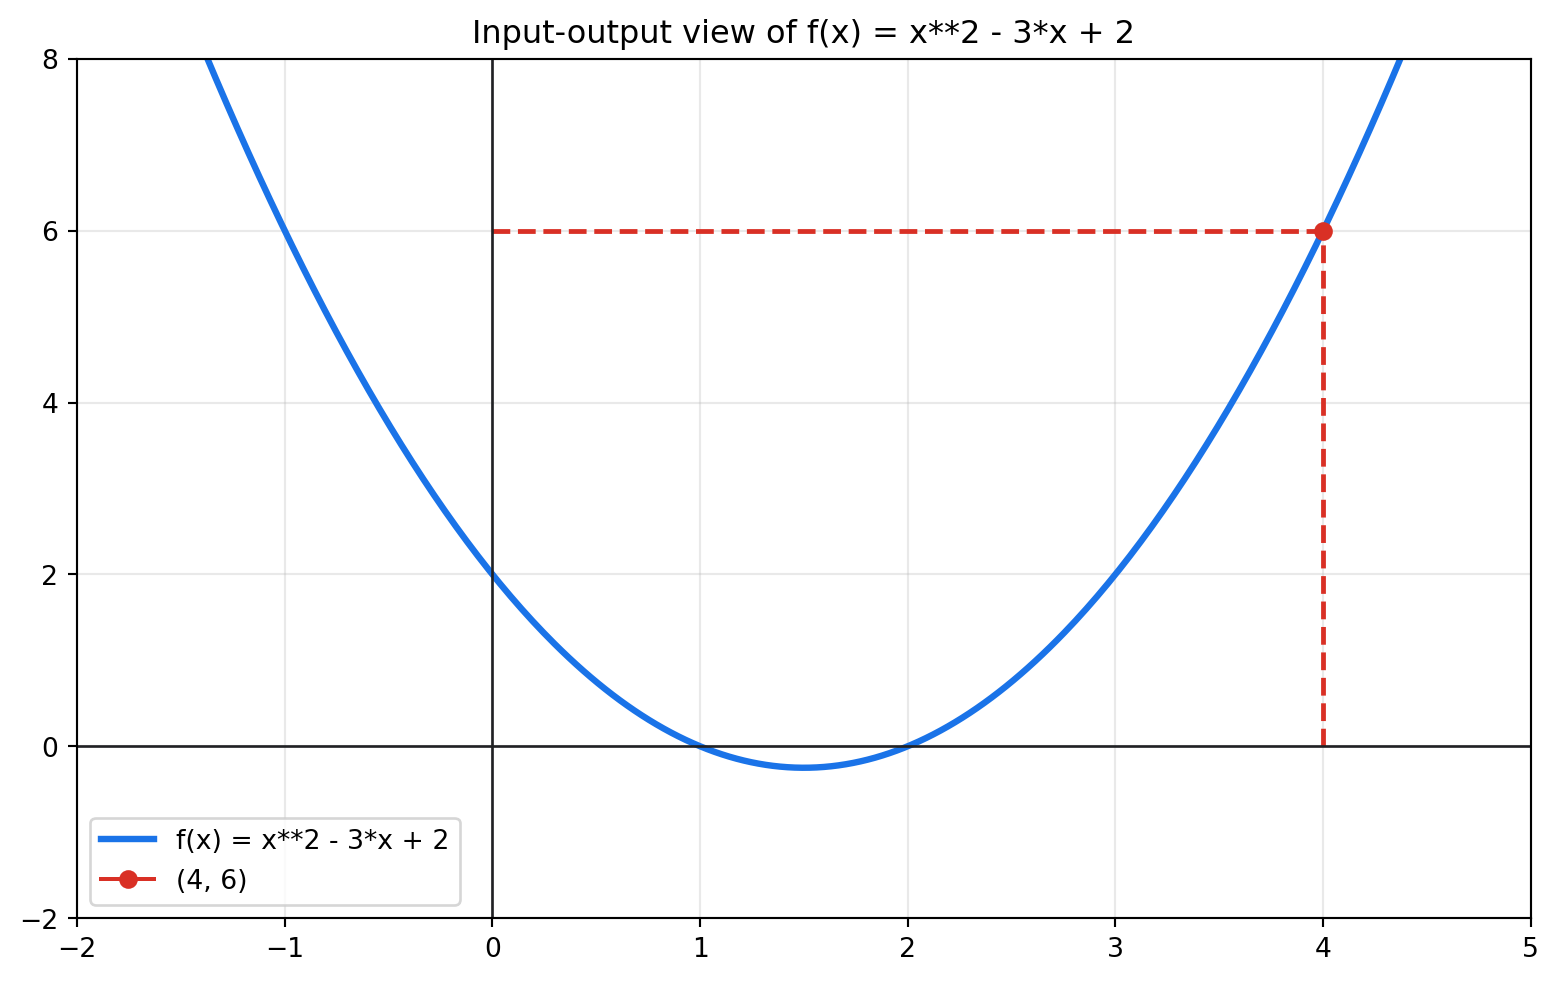
The dashed guides show that input x = 4 produces output f(4) = 6.
Intercepts and zeros
An x-intercept is a point where the graph crosses the x-axis. Algebraically, this means:
f(x) = 0A zero or root of a function is an input that makes the output zero.
For:
f(x) = x^2 - 3x + 2factor:
f(x) = (x - 1)(x - 2)The zeros are:
x = 1 and x = 2The y-intercept occurs at x = 0:
f(0) = 2Average rate of change
The average rate of change from x = a to x = b is:
(f(b) - f(a))/(b - a)This is the slope of the secant line through (a, f(a)) and (b, f(b)).
For f(x) = x^2, from x = 1 to x = 4:
(f(4) - f(1))/(4 - 1) = (16 - 1)/3 = 5This idea becomes the derivative in calculus when the interval becomes very small.
Comparing function families
Different formulas create different shapes. Recognizing these shapes helps you guess models from data and understand transformations later.
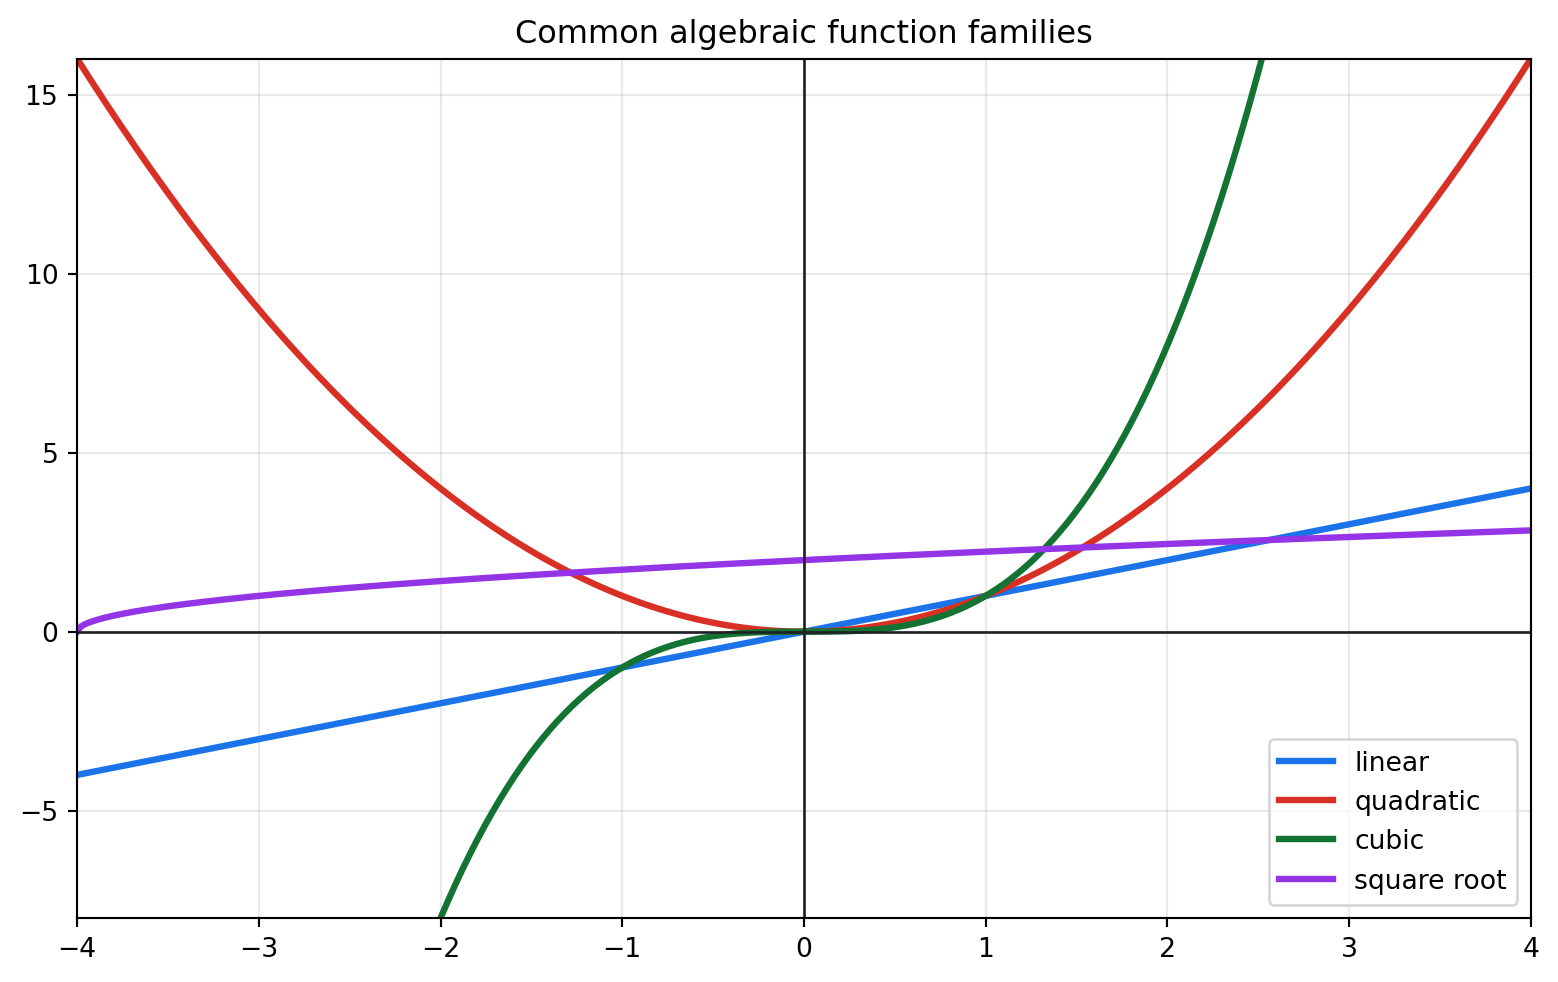
Questions to ask when reading a graph:
- Is it increasing, decreasing, or both?
- Does it have a lowest or highest point?
- Where does it cross the axes?
- Is it symmetric?
- Does it grow slowly, linearly, quadratically, or faster?
- Does the formula restrict the domain?
Vertical line test
A graph represents a function of x if every vertical line intersects the graph at most once.
Why? A vertical line fixes one input x. If it touches the graph twice, then the same input has two outputs, which violates the definition of a function.
WarningLimitation
The vertical line test is a graph test. It does not replace understanding the rule or the domain. A table or formula may be a function even before you draw it.
Worked examples
Example 1: evaluate and interpret
Let:
f(x) = 3x - 2Then:
f(4) = 3(4) - 2 = 10The point (4, 10) lies on the graph.
Example 2: domain from a formula
Find the real domain:
g(x) = 1/(x - 5)The denominator cannot be zero:
x - 5 != 0So:
x != 5The domain is (-∞, 5) ∪ (5, ∞).
Example 3: average rate of change
Let:
h(x) = x^2 - 1Average rate of change from x = 2 to x = 5:
(h(5) - h(2))/(5 - 2)
= ((25 - 1) - (4 - 1))/3
= (24 - 3)/3
= 7
Common mistakes
Confusing input and output
In f(3) = 7, the input is 3 and the output is 7.
Treating every curve as a function
A circle is not a function of x because many x-values correspond to two y-values.
Forgetting the domain
The formula 1/(x - 5) looks simple, but it excludes x = 5.
Thinking a sampled table proves everything
A table shows selected values. It can suggest a pattern, but it does not prove the formula’s behavior for all inputs.
Practice
- Find
f(4)forf(x) = 3x - 2. - Find
g(-1)forg(x) = x^2 + 2x. - Identify the slope and y-intercept of
y = -2x + 5. - Find the domain of
1/(x + 4). - Find the domain of
sqrt(2x - 6). - Find the zeros of
f(x) = x^2 - 5x + 6. - Compute the average rate of change of
f(x)=x^2fromx=2tox=6. - Which grows faster for large positive
x:x,x^2, or2^x? - Give an example of a relation that is not a function.
- Challenge: explain why a vertical line fails to be a function of
x.
Solutions
TipSolution 1
f(4) = 3(4) - 2 = 10.
TipSolution 2
g(-1) = (-1)^2 + 2(-1) = 1 - 2 = -1.
TipSolution 3
Slope -2; y-intercept 5.
TipSolution 4
The denominator cannot be zero, so x + 4 != 0. Therefore x != -4.
TipSolution 5
The radicand must be nonnegative: 2x - 6 >= 0. Therefore x >= 3.
TipSolution 6
Factor: x^2 - 5x + 6 = (x - 2)(x - 3). The zeros are x = 2 and x = 3.
TipSolution 7
(f(6)-f(2))/(6-2) = (36 - 4)/4 = 8.
TipSolution 8
2^x eventually grows faster than any fixed power such as x or x^2.
TipSolution 9
The equation x^2 + y^2 = 1 describes a circle, which is not a function of x because many x-values have two y-values.
TipSolution 10
A vertical line has one x-value and many y-values. A function of x must assign each input x-value exactly one output.
Why this matters later
- Calculus: derivatives and integrals are operations on functions.
- Linear algebra: transformations are functions between vector spaces.
- Statistics: regression models are functions with fitted parameters.
- Optimization: objective functions are maximized or minimized over a domain.
Subtopic guided practice and checkpoints
Functions connect formulas, tables, graphs, and verbal descriptions. In each lab, make a prediction before calculating.
Lab 1: decide whether a relation is a function
Guess first. Can one input have two outputs and still be a function?
Guided exercise.
A relation is a function when each input has exactly one output. The set {(1, 4), (2, 5), (1, 6)} is not a function because input 1 points to both 4 and 6.
Checkpoint. Decide whether {(-1, 3), (0, 3), (2, 7), (3, 7)} is a function. Explain your reason using the words input and output.
Lab 2: evaluate a function from a formula
Guess first. For f(x) = x^2 - 3x + 2, do you expect f(4) to be positive, negative, or zero?
Guided exercise.
f(x) = x^2 - 3x + 2
f(4) = 4^2 - 3(4) + 2
     = 16 - 12 + 2
     = 6
Checkpoint. For g(t) = 2t^2 + t - 1, compute g(-2) and g(0). Show the substitution step.
Lab 3: find domain restrictions from a formula
Guess first. Which inputs are forbidden in h(x) = sqrt(x - 1)/(x + 3)?
Guided exercise.
- The square root requires
x - 1 >= 0, sox >= 1. - The denominator requires
x + 3 != 0, sox != -3. - Since
x >= 1already excludes-3, the domain is[1, infinity).
Checkpoint. Find the domain of p(x) = sqrt(5 - x)/(x - 2). State both the root condition and the denominator condition before combining them.
Lab 4: average rate of change
Guess first. If a graph rises from y = 2 to y = 10 while x moves from 1 to 5, is the average rate positive or negative?
Guided exercise.
average rate = change in output / change in input
             = (10 - 2)/(5 - 1)
             = 8/4
             = 2
For a formula, compute the two output values first, then use the same fraction.
Checkpoint. For f(x) = x^2, find the average rate of change from x = 1 to x = 4. Interpret the answer in one sentence.
Guessing game checkpoint
Before moving to the Python/SymPy appendix, practice the core moves from this lesson. This short quiz may show an expression, graph, equation, solution set, or description and ask you to choose the matching mathematical object.
Using this lesson with edumath and SymPy
Use edumath to move from formula to table to graph. This is useful when you want to test how a formula behaves before doing more formal analysis.
from edumath.algebra import expression_table, input_output_scene

expression_table("x**2 - 3*x + 2", inputs=(-1, 0, 1, 2, 3, 4))
((-1.0, 6.0), (0.0, 2.0), (1.0, 0.0), (2.0, 0.0), (3.0, 2.0), (4.0, 6.0))scene = input_output_scene("x**2 - 3*x + 2", x_value=4, x_min=-2, x_max=5)
fig, ax = scene.render()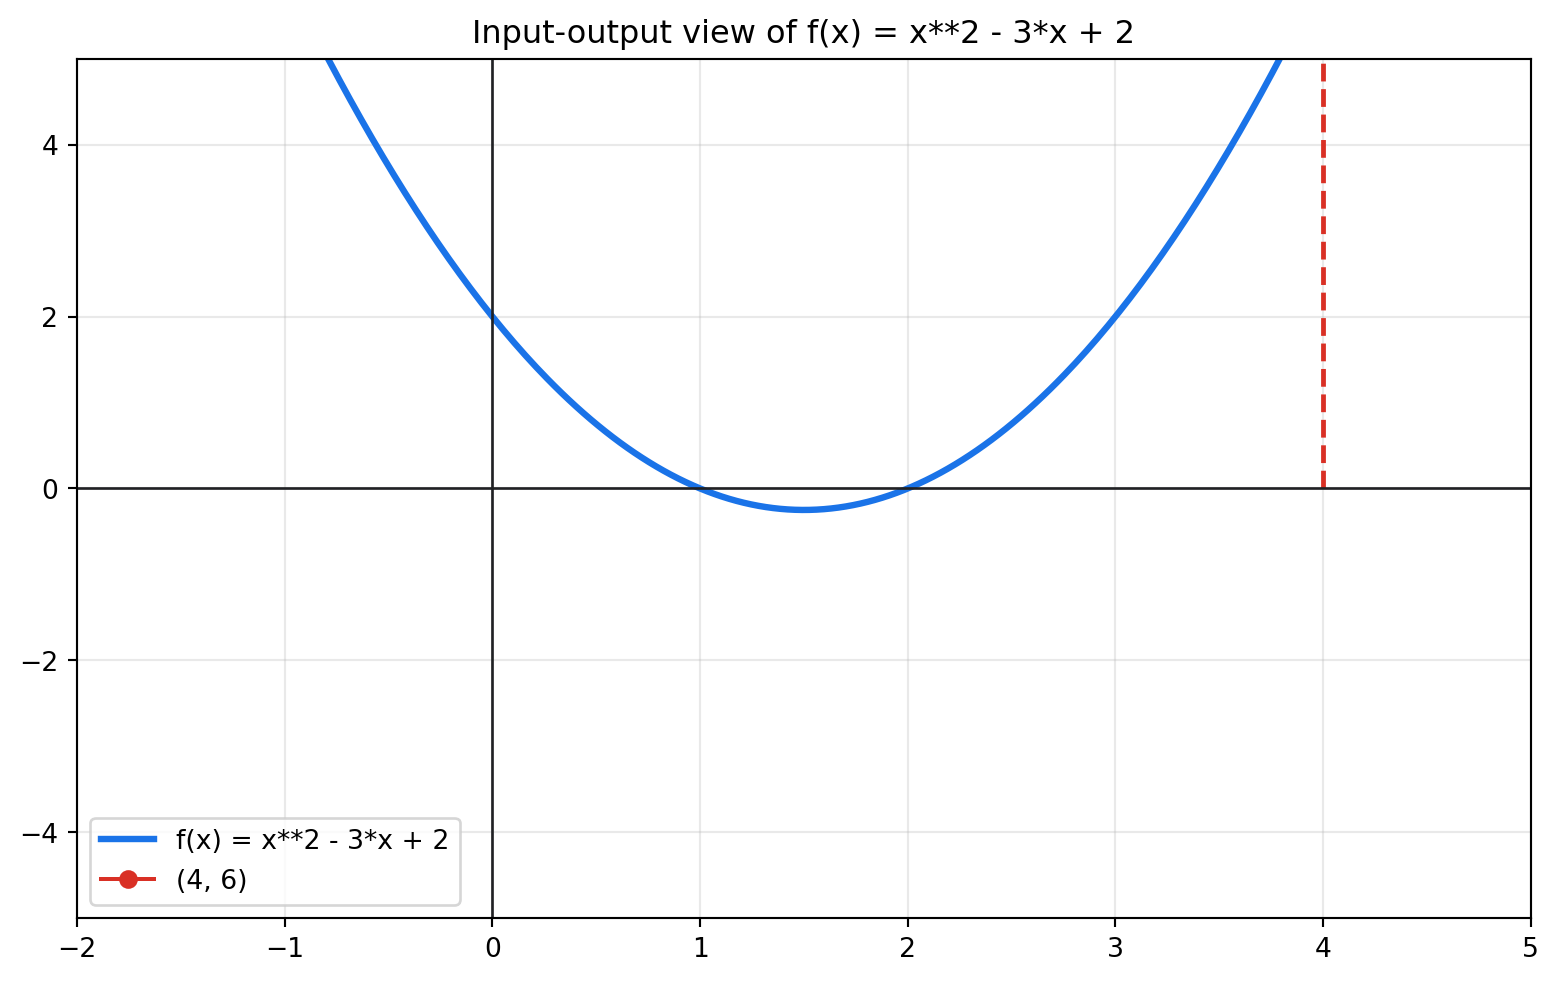
Further reading
- OpenStax, College Algebra 2e, Chapter 3: https://openstax.org/books/college-algebra-2e/pages/index
- Gelfand, Saul, and Yaglom, Functions and Graphs.
- Khan Academy, Algebra 2, function transformations and modeling: https://www.khanacademy.org/algebra2