'Correct.'Algebra Study Path
A complete algebra preparation path for advanced quantitative study.
Algebra is the language used to describe change, constraints, models, and unknown quantities. A learner preparing for graduate-level quantitative work does not need algebra as a list of tricks; they need algebra as a reliable way to move among formulas, graphs, tables, verbal descriptions, and computational experiments.
This section is being rebuilt as a complete preparation module. The goal is to make every algebraic idea usable in later lessons on calculus, linear algebra, probability, statistics, optimization, differential equations, and modeling.
What this path prepares you to do
By the end of this Algebra path, you should be able to:
- manipulate expressions without losing domain restrictions;
- solve equations and inequalities and interpret their solution sets;
- read and produce graphs from formulas;
- recognize how parameters change the shape of a function;
- factor, expand, and analyze polynomial expressions;
- work with rational, radical, exponential, and logarithmic functions;
- solve and graph systems of equations;
- translate word problems and data patterns into algebraic models;
- use SymPy responsibly to check work, generate examples, and explore patterns.
Recommended sequence
NoteFull preparation path
- Expressions and equations
- Inequalities and absolute value
- Functions and graphs
- Transformations, composition, and inverses
- Linear and quadratic functions
- Polynomials
- Rational and radical functions
- Exponentials and logarithms
- Systems of equations
- Algebraic modeling
- Symbolic computation with SymPy
- Cumulative review
The full twelve-topic path is now represented in the sidebar. Study it in order if you are rebuilding algebra from the ground up, or use the cumulative review to diagnose which earlier pages deserve another pass.
Foundations: expressions, equations, inequalities, functions, graphs, and transformations.
Function families: linear, quadratic, polynomial, rational, radical, exponential, and logarithmic functions.
Problem solving: systems, modeling, symbolic computation, and cumulative mixed review.
Diagnostic checklist
Use this checklist before moving quickly through Algebra. If any item feels uncomfortable, study that topic slowly and work the exercises.
- Can you explain the difference between an expression, an equation, and an identity?
- Can you solve
3x - 7 = 11and check the answer? - Can you solve
-2 <= 3x + 1 < 10and write the answer in interval notation? - Can you compute
f(4)forf(x) = x^2 - 3x + 2? - Can you identify the domain of
sqrt(x - 2)/(x + 1)? - Can you describe how
y = 2(x - 3)^2 + 1differs fromy = x^2? - Can you factor
x^2 - 5x + 6? - Can you solve a two-equation linear system and interpret the intersection point graphically?
- Can you explain why logarithms undo exponentials?
- Can you use a graph to estimate roots and then verify them symbolically?
A small auto-checkable diagnostic
The package’s quiz model can use SymPy to derive answers. That means many questions do not need a manually typed expected value; the expected answer can come from a resolver such as expand, factor, or solve.
Formula, table, graph: one idea in three forms
Algebra becomes powerful when you can translate among representations. The same function can be studied as a formula, a table, and a graph.
((-1.0, 6.0), (0.0, 2.0), (1.0, 0.0), (2.0, 0.0), (3.0, 2.0), (4.0, 6.0))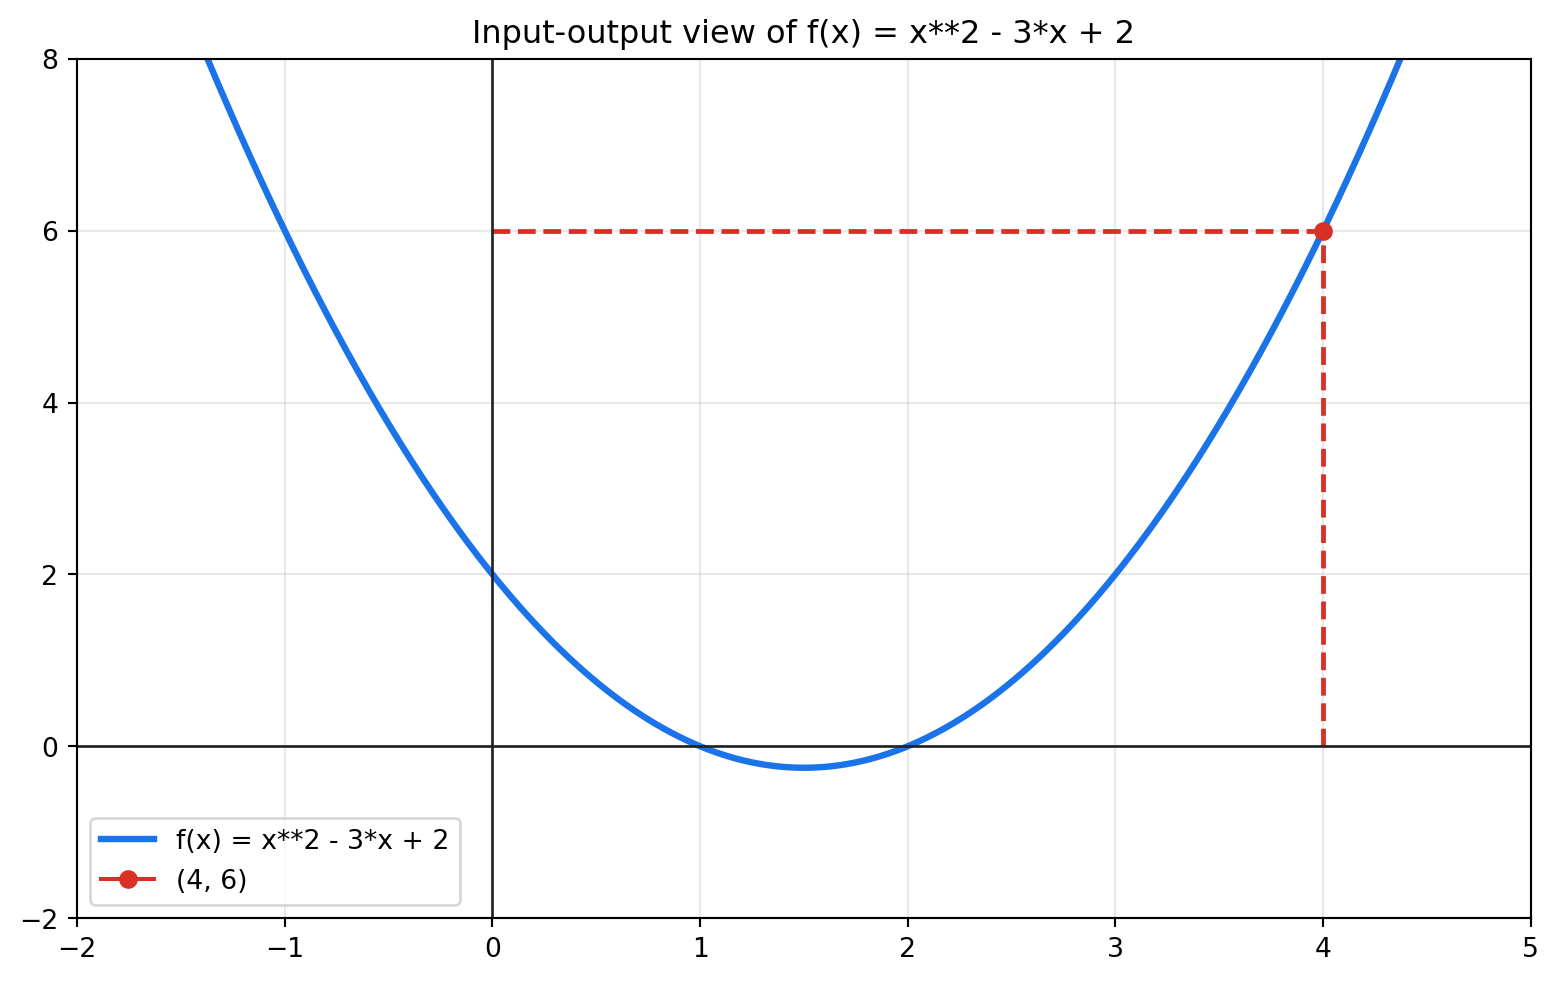
How the upgraded lessons are organized
Each Algebra lesson now includes a guided practice layer in addition to the main examples:
- guess first prompts that train estimation and method selection;
- guided exercises that show one small algebraic move at a time;
- checkpoint exercises that ask you to repeat the same reasoning without the solution immediately visible;
- a topic-specific browser guessing game near the end of the lesson;
- a final
edumathand SymPy appendix for checking work computationally.
When a problem involves solving, copy the step format by hand: write the original problem, change one thing per line, name the operation, and check the result in the original problem.
How to study these lessons
For each lesson:
- Read the motivation before looking at formulas.
- Work through each example by hand.
- Run the Python/SymPy cells when available.
- Change the inputs in the examples and predict what should happen.
- Attempt every exercise before opening the hidden solution.
- Write a short explanation of the idea in your own words.
Using this lesson with edumath and SymPy
The lessons hide most implementation code so you can focus on mathematics. When you work in a notebook or Google Colab, you can import the same helpers directly and use them as study tools.
from edumath.algebra import expression_table, input_output_scene

expression_table("x**2 - 3*x + 2", inputs=(-1, 0, 1, 2, 3, 4))
((-1.0, 6.0), (0.0, 2.0), (1.0, 0.0), (2.0, 0.0), (3.0, 2.0), (4.0, 6.0))scene = input_output_scene("x**2 - 3*x + 2", x_value=4, x_min=-2, x_max=5)
fig, ax = scene.render()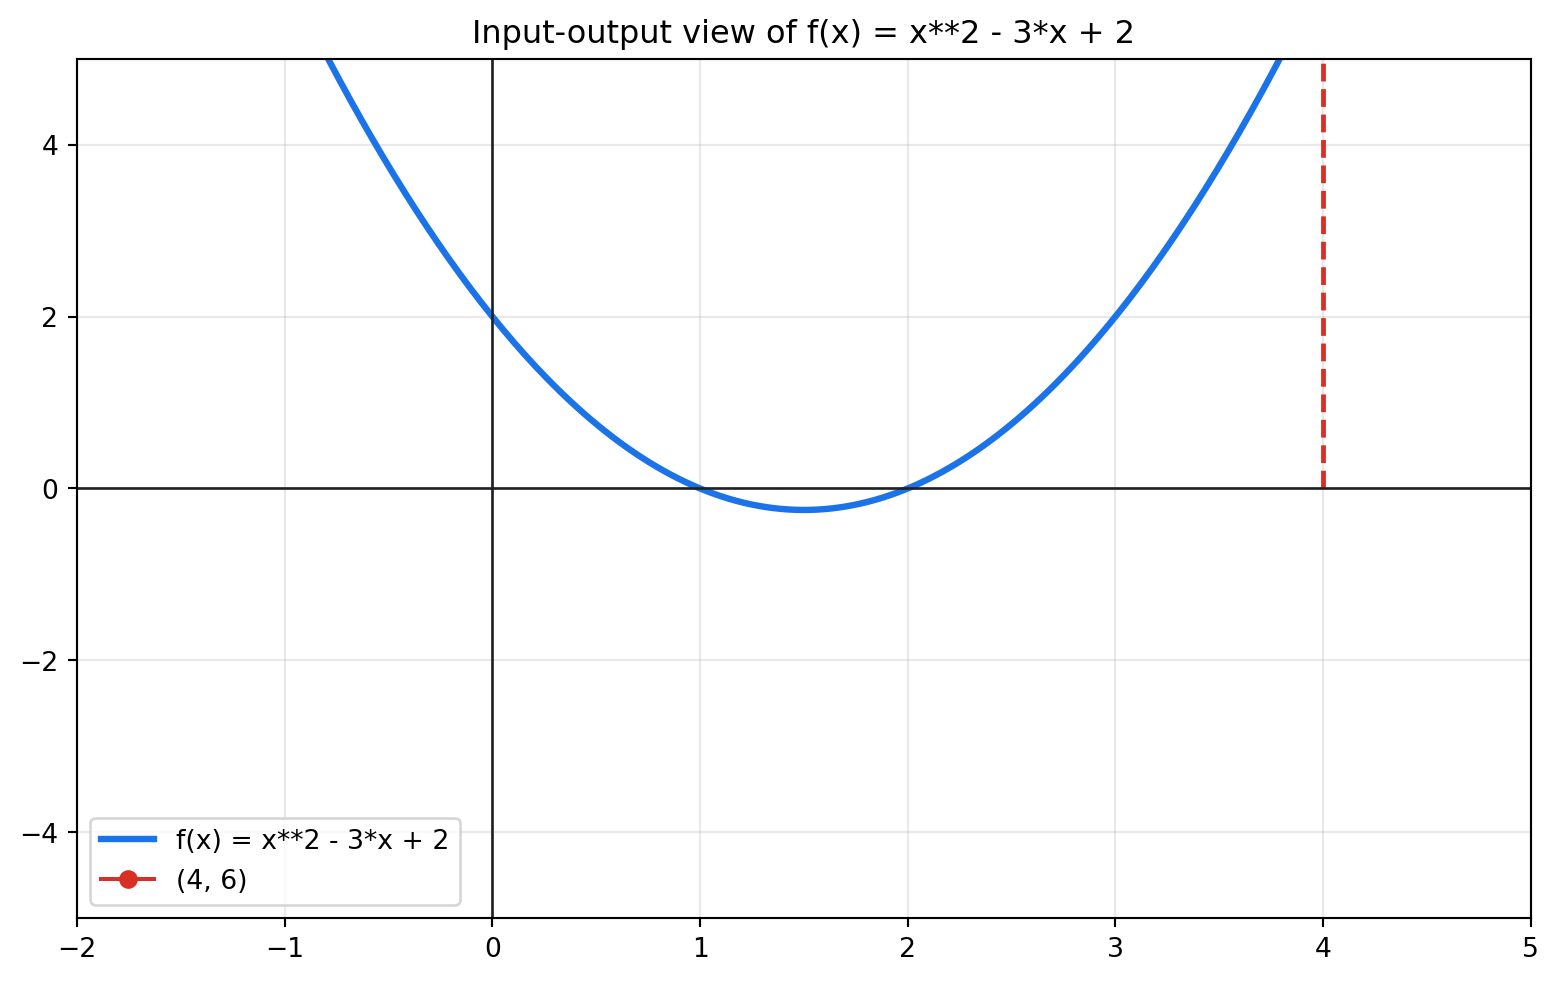
Further reading
- OpenStax, College Algebra 2e: https://openstax.org/books/college-algebra-2e/pages/index
- OpenStax, Precalculus: https://openstax.org/books/precalculus/pages/index
- Khan Academy, Algebra 2: https://www.khanacademy.org/algebra2
- Paul’s Online Math Notes, Algebra: https://tutorial.math.lamar.edu/
- Gelfand, Saul, and Yaglom, Functions and Graphs.
- Serge Lang, Basic Mathematics.